Read an options implied volatility surface
Implied volatility by strike and expiry for a ticker: skew, term structure and how current IV compares with realised volatility.
Are this stock's options cheap or expensive?
The volatility surface shows implied volatility across strikes (skew) and expiries (term structure). Comparing implied with realised volatility indicates whether options price more movement than the stock has delivered.
What you see in Market Ontology
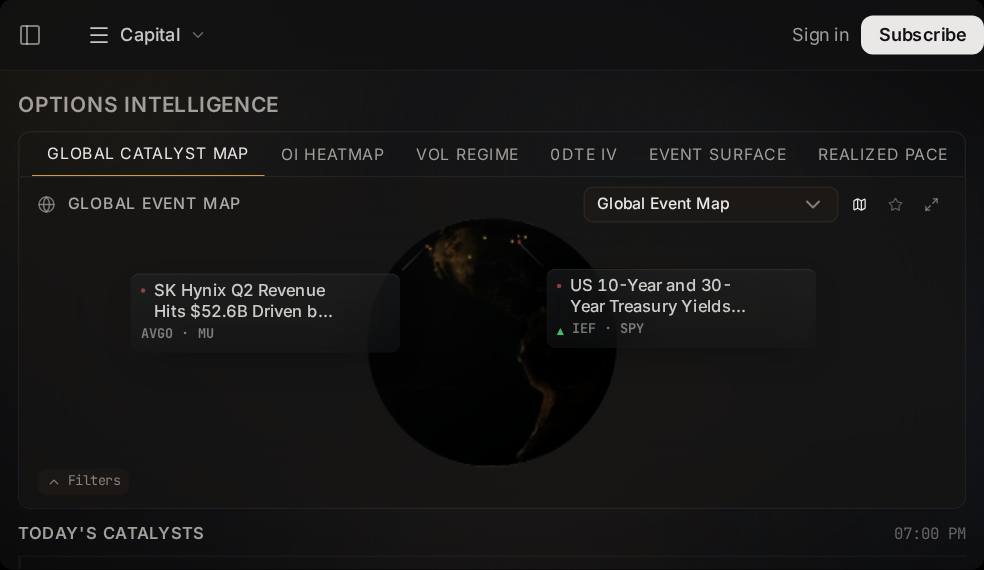
The live product, read-only. Your own work opens here after checkout.
Start the job
What opens after checkout
Dated skew/term-structure comparison with quote-quality flags, built from the details above and saved to your account in Options.
- You get
- Dated skew/term-structure comparison with quote-quality flags
- Opens in
- Options
- Built from
- Underlying, expiries, strikes/deltas, filters
- Orders
- None; nothing is sent on your behalf