Macro newsletter alternative
Put the investment ideas you read to work.
Take a thesis from what you read, test it with a model or a study, and save the decision with the conditions that would change it.
Sentinels keep checking those conditions, and supported orders run through your connected brokerage after review.
Monthly billing. Cancel anytime.
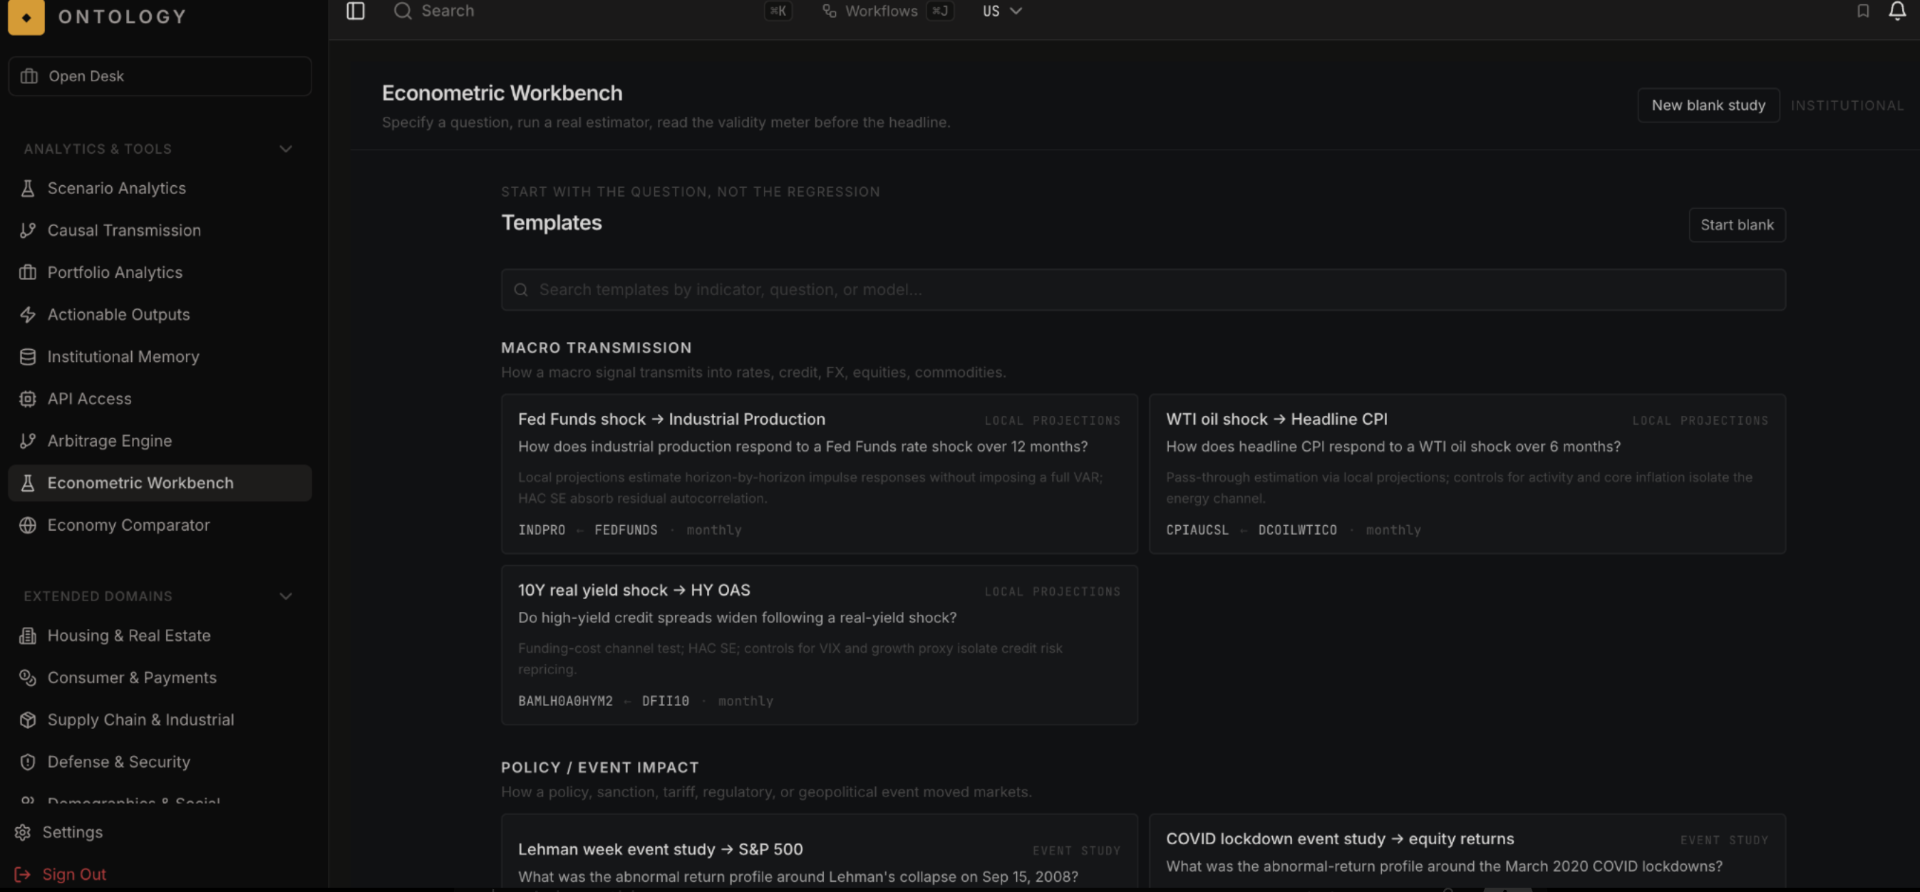
Test the evidence behind the investment.
Run an event study, estimate a market relationship or examine how a response develops over time.
Choose the sample, variables and controls. Review the results and diagnostics. Save the specification with the output so the study can be revisited and compared.
Open a published studyWork in the financial model itself.
Build a DCF, LBO, merger, three-statement or comparables model. Inspect the formulas, change assumptions and test how the result moves.
The Analyst can propose changes inside the model. You examine the proposed inputs and apply them to the calculation.
If your process already runs in Excel, connect your Microsoft account to update selected workbook cells, recalculate the workbook and compare the output before and after the change.
Open the DCF modelKeep the conditions behind your decision under observation.
Attach measurable conditions to the research. Sentinels compare those conditions with available observations and retain the evidence from each evaluation.
See which assumptions still hold, which have been contradicted and which cannot yet be resolved.
See Sentinel templatesContinue into your connected brokerage account.
Review holdings, prepare an order or rebalance, and send supported orders through the connected brokerage after you review them.
For recurring strategies, define an investment mandate with instruments, a schedule, capital limits and an expiry. Choose whether it performs research, prepares plans or executes within the authority you grant.
See automated portfolio workflowsPrepare the work for other people.
Develop company research with linked sources and revision history. Review changes to the analysis and export a presentation, PDF or memo for the people who need to make the decision.
Open company researchTrace a shock through connected markets.
Examine modeled transmission paths from a development to rates, credit, currencies, commodities and equities. The model uses fixed, visible coefficients, so every assumption can be inspected and challenged.
Open trade researchMarket Ontology and Macro newsletters
| Need | Market Ontology | Macro newsletters |
|---|---|---|
| Ideas | Software to test the idea with your own inputs. See it | Written analysis and opinion from the author. |
| Statistical research | Event studies, local projections, factor regressions and cointegration tests with saved specifications. See it | Charts and argument in the issue. |
| Assumption monitoring | Sentinels evaluate measurable conditions against observations and keep the evidence history. See it | The next issue. |
| Access | Desk $399/month, self-serve checkout, cancel anytime. See it | Varies by publication. |
Questions
Should I stop reading newsletters?
No. Newsletters are a source of ideas. Market Ontology is where you test, decide and monitor them.
Which brokerages work with Market Ontology?
Orders route through supported accounts connected via Alpaca or SnapTrade. Each order is reviewed and authorized by the account owner; mandates act only within the limits you set.
Does Market Ontology include exchange data feeds or messaging?
No. It does not provide licensed exchange connectivity, a messaging network or vendor datasets. Company figures come from SEC filings and economic series from public sources such as FRED.
What does Desk cost?
$399 per month, billed at checkout, cancel anytime. The free tools and public examples need no account.
Open your investment desk.
Desk brings research, financial modeling, econometric studies, monitoring and supported brokerage workflows into one subscription.
Try it freeMonthly billing. Cancel anytime.