Measure portfolio performance against a benchmark
Time-weighted return, volatility, drawdown and benchmark comparison for a portfolio, with the data coverage behind each figure shown.
How has my portfolio performed versus its benchmark?
Performance analysis links daily returns into a time-weighted return so deposits and withdrawals do not distort results, then compares return, volatility and maximum drawdown with a benchmark over the same window.
What you see in Market Ontology
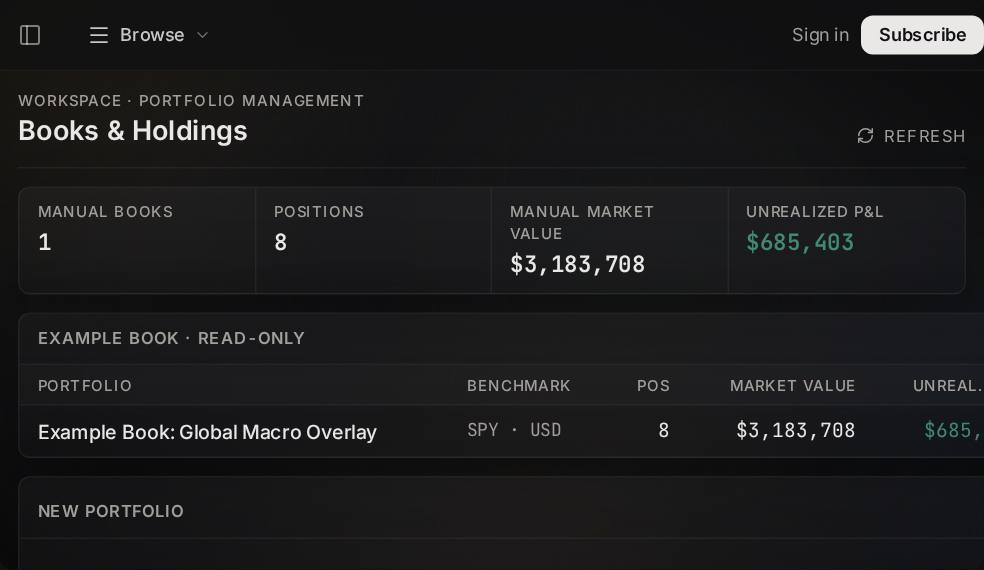
The live product, read-only. Your own work opens here after checkout.
Start the job
What opens after checkout
Available return history, volatility, benchmark comparison and data-coverage record, built from the details above and saved to your account in Capital Command.
- You get
- Available return history, volatility, benchmark comparison and data-coverage record
- Opens in
- Capital Command
- Built from
- Portfolio and measurement period
- Orders
- None; nothing is sent on your behalf